PGF/TikZ figures
This page contains a collection of PGF/TikZ figures I’ve created, along with their corresponding code. While the content isn’t particularly advanced, I find it useful to maintain a public archive of these figures. It’s a convenient reference for me and might also be helpful to others. Feel free to reuse the code as you like!
Differentiable map between manifolds
\documentclass{standalone}
\usepackage{mathtools,amssymb,amsthm,amsfonts,amscd,amsmath,mathrsfs}
\usepackage[svgnames,dvipsnames]{xcolor}

\definecolor{AccColor1}{HTML}{C41E3A}
\definecolor{AccColor2}{HTML}{233F8D}

\usepackage[colorlinks=true]{hyperref}
\hypersetup{urlcolor=LinkColor1,linkcolor=LinkColor2,citecolor=LinkColor2}
\usepackage{tikz}
\usepackage{pgfplots}
\usepgfplotslibrary{fillbetween}
\usepgflibrary{patterns}
\usetikzlibrary{patterns,arrows}
\usepackage{tikz-3dplot}
\usepackage{tkz-euclide}
\usetikzlibrary{math,shapes,calc,positioning,fit,decorations.markings}
\usepackage{pgfplots}
\pgfplotsset{compat=newest}
\usepackage[active,tightpage]{preview}
\PreviewEnvironment{tikzpicture}
\setlength\setlength{2mm}

\tikzset{state/.style={circle,draw,minimum size=6ex},
arrow/.style={-latex, shorten >=1ex, shorten <=1ex}}

\begin{document}
    \begin{tikzpicture}[scale=.5]
        % Boule 1
        %% Boule
        \shade[ball color = gray!90, opacity = 0.2] (0,0) circle (4cm);
        \draw[thick] (0,0) circle (4cm);
        \draw[thick, rotate=30] (-4,0) arc (180:360:4 and 1);
        \draw[thick, rotate=30] (0,-4) arc (270:90:1 and 4);
        \node at (0,4.2) [above] {$M$};
        % Ouvert U de la boule 1
        \node (q1) at (-.5,.5) {};
        \node (q2) at (1.5,.5) {};
        \node (q3) at (1.7, 2) {};
        \node (q4) at (0, 3) {};
        \path[fill,AccColor1!50] plot [smooth cycle,tension=1]
				coordinates {(q1) (q2) (q3) (q4)};
        \path[thick, draw, black] plot [smooth cycle,tension=1]
				coordinates {(q1) (q2) (q3) (q4)};
        \node at (.5,1.4) {$U$};

        % Boule 2
        %% Boule
        \shade[ball color = gray!90, opacity = 0.2] (15,0) circle (4cm);
        \draw[thick] (15,0) circle (4cm);
        \draw[thick] (11,0) arc (180:360:4 and 1);
        \draw[thick] (15,-4) arc (270:90:1 and 4);
        \node at (15,4.2) [above] {$N$};
        % Ouvert V de la boule 2
        \node (q1) at (11.8,.5) {};
        \node (q2) at (13.3,.5) {};
        \node (q3) at (13.5, 2) {};
        \node (q4) at (12.5, 1.9) {};
        \path[fill,AccColor2!50] plot [smooth cycle,tension=1]
				coordinates {(q1) (q2) (q3) (q4)};
        \path[thick,draw,black]plot [smooth cycle,tension=1]
				coordinates {(q1) (q2) (q3) (q4)};
        \node at (12.8, 1.1) {$V$};

        % Flèches
        \draw[very thick, arrow, bend angle=10, bend left]
				(3.5,3.5) to (11.5,3.5);
        \node at (7.5,4) [above] {$f$};
        \draw[very thick, arrow] (0,-4) to (0,-7);
        \node at (0,-5.5) [left] {$\varphi$};
        \draw[very thick, arrow] (15,-4) to (15,-7);
        \node at (15,-5.5) [right] {$\psi$};
        \draw[very thick, arrow, bend angle=10, bend left]
				(2,-7) to (12.5,-7);
        \node at (7.25,-6.5) [above] {$\psi\circ f\circ\varphi^{-1}$};

        % Blob Rn
        \node (q1) at (-1,-7) {};
        \node (q2) at (.8,-7.1) {};
        \node (q3) at (.7,-8.3) {};
        \node (q4) at (-1.3,-8.4) {};
        \path[draw,thick,black] plot [smooth cycle,tension=1]
				coordinates {(q1) (q2) (q3) (q4)};
        \node at (-1.3,-7) [left] {$\R^n$};

        % Blob Rp
        \node (q1) at (14,-7) {};
        \node (q2) at (15.8,-7.1) {};
        \node (q3) at (15.7,-8.3) {};
        \node (q4) at (13.6,-8.2) {};
        \path[draw,thick,black] plot [smooth cycle,tension=1]
				coordinates {(q1) (q2) (q3) (q4)};
        \node at (16,-7) [right] {$\R^p$};
	\end{tikzpicture}
\end{document}
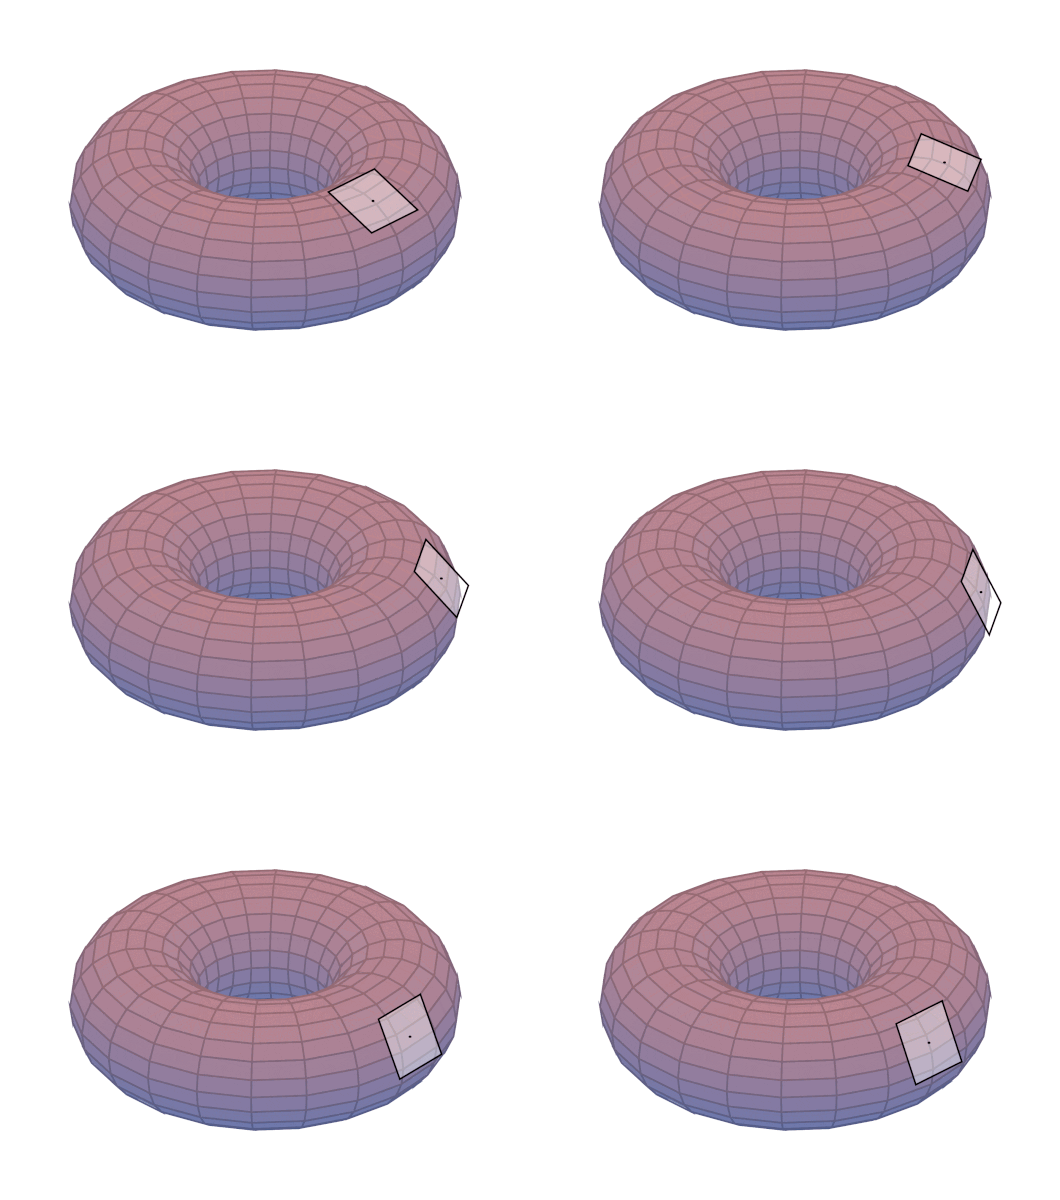
Tangent plane animation
